Part One: Spatial Strategy and Policies (Regulation 19)

Ended on the 29 November 2024

Appendix 4 – Housing Trajectory

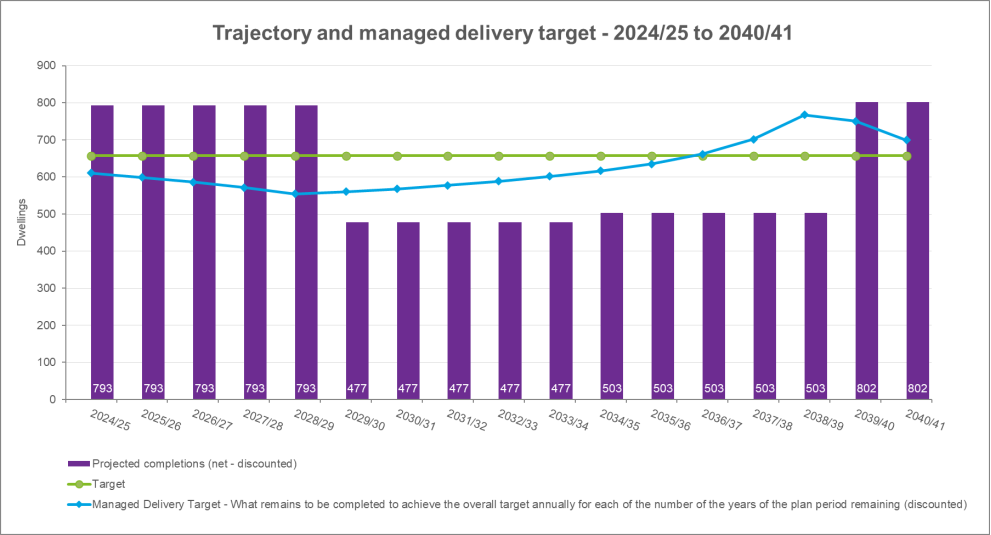
This figure is an indicative housing trajectory for 2024 to 2041 based on discounted housing supply figures.  It is a bar chart that shows how much housing could be delivered over the plan period to 2041 based on available land. The housing supply is compared against the local housing need using the standard method, which shows that there will be a housing shortfall of 699 dwellings at the end of the plan period.

For instructions on how to use the system and make comments, please see our help guide.
back to top back to top