
Part One: Spatial Strategy and Policies (Regulation 18)
8. Housing
Introduction
8.1 The policies in this section will help to create a network of cohesive, healthy, and prosperous communities in Dudley, which is a fundamental element of the Plan's vision and objectives and will deliver the overarching strategic priorities. The provision of sufficient land to promote sustainable housing growth is the cornerstone of this approach. The policies also ensure the provision of a balanced range of housing in terms of type, tenure, wheelchair accessibility and affordability, and sufficient specialist provision for gypsies, travellers, and travelling showpeople, and for those who wish to self or custom build.
8.2 New housing will be of a well-designed high build quality, meeting national space and water efficiency standards, achieving high levels of energy efficiency and adapting to climate change.
8.3 Maximising sustainable transport access to key residential services and focusing high density increases in the areas of greatest accessibility is at the heart of the Spatial Strategy. Providing a balanced network of quality education facilities is a further key part of this approach and to delivering economic prosperity.
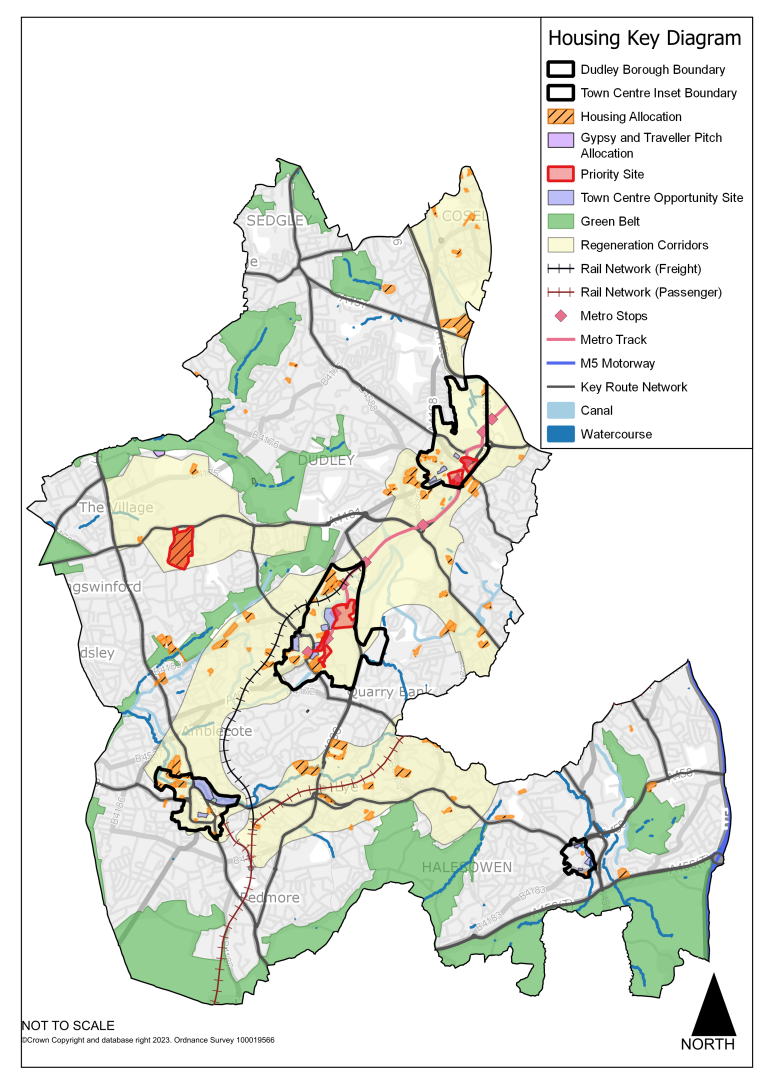
Spatial Strategy Plan: Housing
Delivering Sustainable Growth
(28) Policy DLP10 Delivering Sustainable Housing Growth
- Sufficient land will be provided to deliver at least 10,876 net new homes over the plan period of 2023-2041. They key sources of housing land supply are summarised in Table 8.1 and all housing allocations are set out in DLP Part Two.
- The majority of the requirement will be met through sites with existing planning permission and sites allocated for housing by this Plan. Additional housing supply will also be secured on windfall sites in the urban area in Dudley. The estimated net effect of housing renewal up to 2041 will be reviewed annually and considered in the calculation of housing land supply.
- The development of sites for housing should demonstrate a comprehensive approach, making best use of available land and infrastructure and not prejudicing neighbouring uses. Incremental development of an allocated site will only be allowed where it would not prejudice the achievement of high-quality design on the allocation.
Table 8.1 Dudley Housing Land Supply and Indicative Phasing 2023 - 2041
|
Sources of Supply |
Total |
2023 - 2028 |
2028 - 2033 |
2033 - 2038 |
2038 – 2041 |
|
|
CURRENT SUPPLY (2022/2023) |
Sites under construction |
948 |
948 |
0 |
0 |
0 |
|
Sites with planning permission or prior approval |
1965 |
1965 |
0 |
0 |
0 |
|
|
HOUSING ALLOCATIONS |
Brierley Hill Strategic Centre sites |
1177 |
55 |
334 |
518 |
270 |
|
Brierley Hill Strategic Centre Occupied Employment Land sites |
459 |
0 |
29 |
186 |
244 |
|
|
Dudley Town Centre sites |
682 |
12 |
153 |
473 |
44 |
|
|
Stourbridge Town Centre sites |
291 |
206 |
54 |
31 |
0 |
|
|
Halesowen Town Centre sites |
261 |
84 |
105 |
54 |
18 |
|
|
Regeneration Corridor 1 |
585 |
108 |
216 |
216 |
45 |
|
|
Regeneration Corridor 2 |
854 |
102 |
403 |
128 |
221 |
|
|
Regeneration Corridor 3 |
514 |
154 |
140 |
97 |
123 |
|
|
Regeneration Corridor 4 |
100 |
46 |
20 |
34 |
0 |
|
|
Other – sites outside centres and regeneration corridors |
377 |
128 |
166 |
46 |
37 |
|
|
WINDFALL ALLOWANCES |
Small sites (179 dwellings 22/23) |
2685 |
358 |
895 |
895 |
537 |
|
ADDITIONAL CAPACITY |
Brierley Hill Waterfront Offices (large windfall) |
200 |
200 |
|||
|
Centres uplift allowance (to be updated for 2023/24) |
138 |
138 |
||||
|
TOTAL GROSS HOMES |
11,236 |
4,166 |
2,515 |
2,678 |
1,877 |
|
|
TOTAL LOSS HOMES |
Estimated housing demolitions |
360 |
100 |
100 |
100 |
60 |
|
TOTAL NET HOMES |
10,876 |
4,066 |
2,415 |
2,578 |
1,817 |
|
Justification
8.4 The DLP identifies sufficient land to provide 10,876 additional homes by 2041. This will accommodate 90.98% of current local housing need up to 2041 (homes) with 96.4% of the supply on brownfield land and 3.6% of the supply on greenfield land – this accounts for all housing supply apart from the windfall sites. A balanced range of sites has been provided in terms of size, location, and market attractiveness.
8.5 The detail of the housing allocations across Dudley are provided in DLP Part Two and all sites are shown on the Policies Map. Housing capacity has been identified in accordance with the Spatial Strategy and based on the following information:
- Strategic Housing Land Availability Assessments (SHLAAs) and the Black Country Employment Area Review (BEAR),
- An estimate of likely windfall development on small sites up to 2041,
- An assessment of the likely capacity of the strategic centre,
- Application of a density uplift to existing allocations likely to gain permission after 2027.
8.6 The housing supply from allocations on occupied employment land has been discounted by 15% in order to take account of the multiple delivery constraints that typically affect such sites and that are likely to reduce delivery on a minority of sites. Delivery constraints include poor ground conditions and the need for large-scale master-planning, land assembly, business relocations and residential service access improvements. The supply from sites with planning permission but not yet under construction has been discounted by 10% in accordance with historic lapse rates. These discounts are balanced rates that take account of the likely availability of external funding to address constraints, as set out in the Viability and Delivery Study. Together, these discounts provide sufficient flexibility in the housing land supply to meet any unforeseen circumstances.
8.7 The Plan period has been divided into four phases – 2023 to 2028 (five years), 2028 to 2033 (five-ten years), 2033 to 2038 (ten-fifteen years) and 2038 to 2041 (fifteen to eighteen years). A trajectory showing delivery for each phase is shown in the most up to date SHLAA, which demonstrates a steady supply of housing completions over the Plan period.
Evidence
- Dudley SHLAA 2022/2023
- Black Country Employment Areas Review (2021)
- Dudley Viability and Delivery Study (2023)
Delivery
- Annual update of the SHLAA
- Housing renewal will be delivered through local authority intervention
- Securing funding to facilitate delivery
- Working with key partners and delivery agencies
Housing Density, Type and Accessibility
8.8 It is important that the new homes delivered over the plan period are located in places with good sustainable transport access to key residential services and provide a mix of types and densities which are appropriate to their location and help meet local needs.
(15) Policy DLP11 Housing Density, Type and Accessibility
- The density and type of new housing provided on any housing site should be informed by:
- The need for a range of types and sizes of accommodation to meet identified sub-regional and local needs,
- The level of accessibility by sustainable transport to residential services, including any improvements to be secured through development, as set out in Table 8.2,
- The need to achieve high-quality design and minimise amenity impacts, considering the characteristics and mix of uses in the area where the proposal is located.
- Developments of ten homes or more should provide a range of house types and sizes that will meet the accommodation needs of both existing and future residents, in line with the most recently available information.
- All developments of ten homes or more should achieve the minimum net density set out below, except where this would prejudice historic character and local distinctiveness as defined in Policy DLP55:
- 100 dwellings per hectare where Table 8.2 accessibility standards for very high-density housing are met and the site is located within a Strategic Centre or Town Centre,
- 45 dwellings per hectare where Table 8.2 accessibility standards for high-density housing are met,
- 40 dwellings per hectare where Table 8.2 accessibility standards for moderate-density housing are met.
- DLP Part 2 provides details of the appropriate density and, where appropriate, house type mix, to be sought on each housing allocation site, in accordance with the requirements set out in this Policy. Further details of design requirements for housing developments will be set out in Supplementary Planning Documents.
Table 8.2 Dudley Borough Housing Accessibility Standards
|
Density (homes per hectare net) |
Very High 100+ Only appropriate within a Strategic Centre or Town Centre |
High 45+ |
Moderate 40+ |
|
Indicative proportion of flats |
100% |
>15% |
0-15% |
|
Indicative amount of housing suited to families |
Low |
Medium |
High |
|
Accessibility (by either walking or public transport, unless stated) |
|||
|
Employment – Strategic Centre or other employment area |
20 mins |
20 mins |
30 mins |
|
Health – Primary Care e.g., GP Surgery or Health Centre |
10 mins |
10 mins |
15 mins |
|
Fresh Food – Centre or food store |
N/A |
10 mins |
15 mins |
|
Education – Primary School (walking distance only) |
N/A |
15 mins |
10 mins |
|
Education – Secondary School |
N/A |
25 mins |
20 mins |
Justification
8.9 Achieving an appropriate density and housing type mix is crucial both to the success of each new housing development and the overall sustainability of the Spatial Strategy. It is important that every major development, of ten homes or more, contributes to providing an appropriate house type mix and density, aligned with current local needs. Achieving the right density and mix of house types will also help to protect and improve physical, social and mental health and wellbeing.
8.10 The accessibility of all housing developments to a range of residential services by walking, cycling or public transport is key to achieving sustainable communities. As high-density developments tend to accommodate more people, they should generally be located in those areas with the best access to services, to encourage use of sustainable transport modes. The highest densities of 100 homes per hectare should be in areas with the best access to public transport and services, but also where a high density development presents the best design solution to reflect historic character and distinctiveness. Therefore, such densities will only be acceptable within Strategic Centres and Town Centres. Conversely, lower density developments, accommodating more families, should enjoy high levels of accessibility to schools. Not all developments with good sustainable access to services will be suited to the highest densities – in some cases a lower density will be more appropriate, for example in area of historic character, to reflect the density of adjacent uses or to meet the need for a mix of housing types.
8.11 Table 8.2 provides access standards for differing house type mixes/densities, in relation to four priority residential services: employment, health, fresh food and education. Proxies have been selected for each service. Employment is represented by Strategic Centres and retain employment areas. The proxy used for fresh food is a centre, or an existing good store outside a centre that currently provides a range and choice of fresh food. The access standards have been developed based on survey evidence regarding the distance people are prepared to travel to each service by foot and public transport and are designed to help create well-connected and walkable neighbourhoods. Although open space does not form one of the priority residential services for the purposes of establishing the appropriate density and type of housing, Policy DLP35 taken together with local standards and policies will ensure that a sufficient quantity and quality of different types of open space is available close to where people live.
8.12 Housing developments of ten homes or more will be expected to meet the accessibility standards set out in Table 8.2, which vary according to density and likely house type mix. Where there is an identified gap in service provision against one or more of these standards, investment will be sought to improve either service provision or access to existing services sufficient to ensure standards are met. New service provision, including for centre uses, should be located, and justified in accordance with Policies DLP26 and DLP14 in particular.
8.13 Current accessibility to residential services by sustainable transport modes across Dudley has been modelled. This modelling shows the high levels of accessibility achieved by the Spatial Strategy. However, there are some gaps in the provision that will need to be addressed through service or access improvements. The model will be updated on a regular basis to reflect changes in service provision and public transport services. Local circumstances, such as planned changes to service provision, will be considered when assessing accessibility on a site-by-site basis.
8.14 The Black Country Housing Market Assessment (HMA) 2021 (to be updated for the regulation 19 version of the plan) demonstrates that new households to be generated over the Plan period will need the following mix of home tenures and types.
Table 8.3 Black Country Housing Market Assessment Mix
|
One bedroom |
Two bedrooms |
Three bedrooms |
Four + bedrooms |
|
|
Owner Occupied |
19.1% |
27.9% |
30.5% |
22.6% |
|
Private Rented |
22.2% |
22.3% |
20.3% |
35.2% |
|
First Homes |
20.6% |
26.9% |
33.6% |
18.9% |
|
Shared Ownership |
25.0% |
32.0% |
27.5% |
15.5% |
|
Social Rent / Affordable Rent |
25.7% |
14.9% |
22.2% |
37.2% |
8.15 It is important that housing provision reflects the needs of these new households, allowing for at least one bedroom per person, whilst also reflecting the varying needs set out in the HMA.
Evidence
- Black Country Housing Market Assessment (2021)
- Black Country Urban Capacity Review Update (2023)
Delivery
- Supplementary Planning Documents
- Development Management process